
Social Mobility
2018
Client: Pittsburgh City, Carnegie Mellon University
Team: Josh LeFevre
Duration: 5 weeks
Tools: After Effects, Illustrator, Photoshop, Physical prototyping, Laser cutter, Wood, Acrylic, U.S. Census data, Allegheny County data, and Excel
My role: Design strategist, Data analyst, Creator,
Objective
Making data meaningful and accessible using various forms of visualization.
Solution
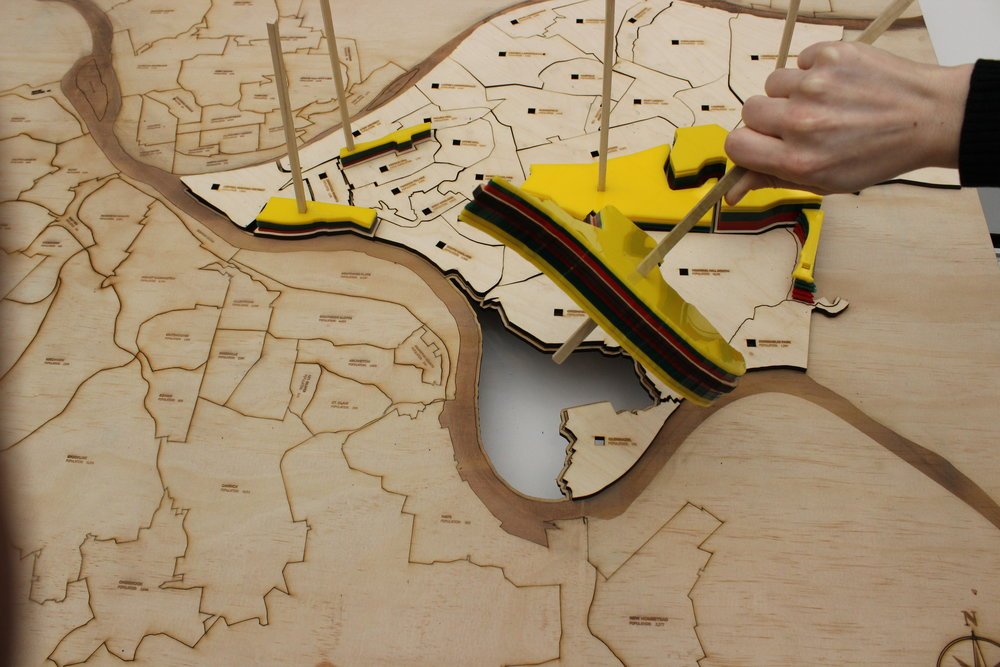
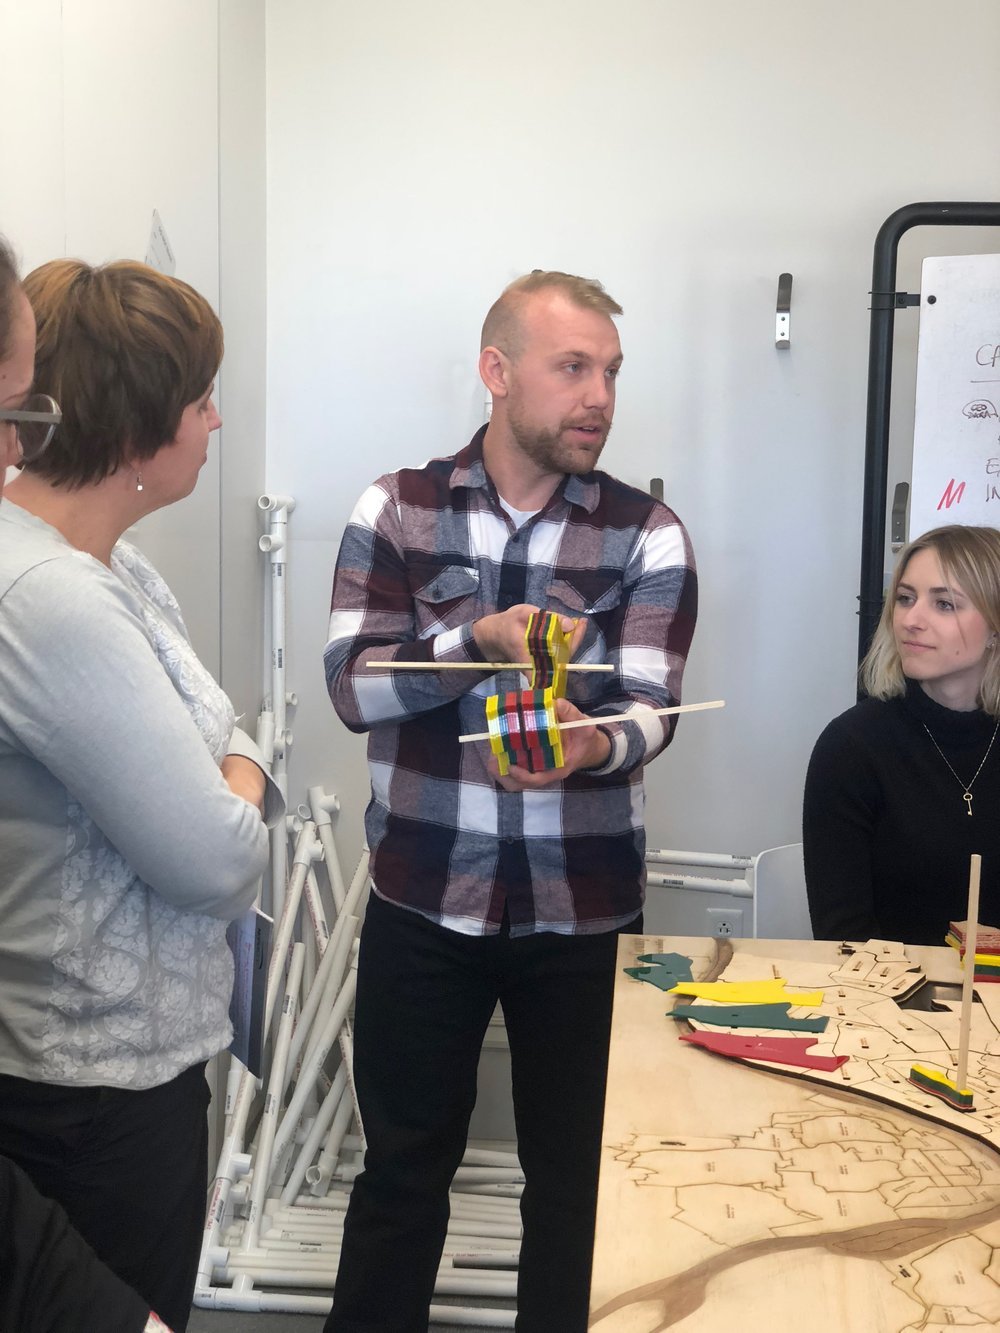
A physical data installation showing the social mobility comparison between parents and their children. This installation would live within a public building or policy office to encourage conversations and discussions around the topic. This exploration is only a prototype of what a full installation could look like.
Purpose/Mission
Encourage conversation around factors influencing social mobility.
Compare Social mobility by county/region
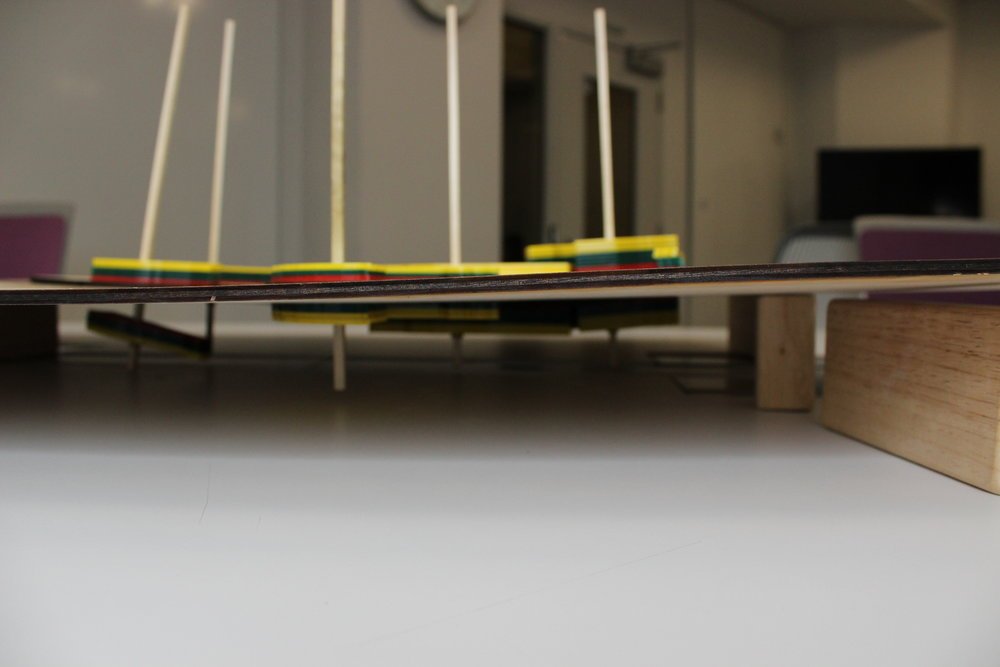
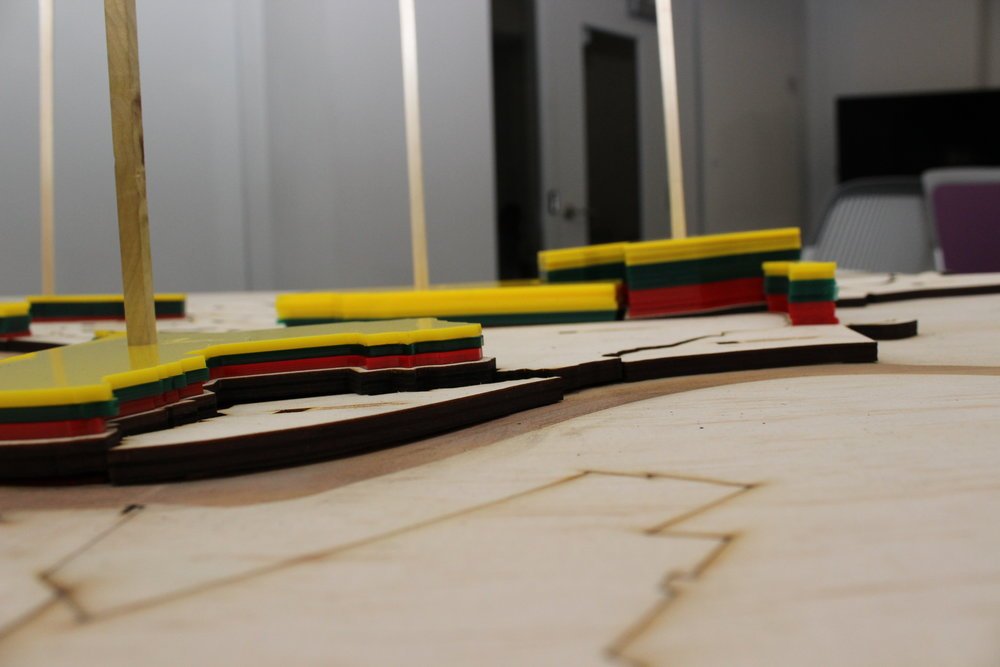
Compare predicted child social mobility (above the board) with parent social mobility (below the board

Data for each later is engraved on each piece.

Each layer In the stack related to a different element related to social mobility as defined by researchers.